Patterns of movement in cities, especially office job commutes, were substantially altered in 2021 by telework, economic change, and other responses to COVID-19, according to new research from the Accessibility Observatory at the University of Minnesota. While the immediate effects of these behavioral changes, such as reduced congestion and lower transit ridership, have been well documented, new data reveals deeper impacts that differ by the three modes studied: auto, transit, and biking.
The most striking finding in the auto analysis was how limits on access to opportunities during the peak morning travel period were almost entirely eliminated. The top 50 most populous urban areas in the US saw significant increases in access to jobs by driving during the morning peak. For example, compared to pre-pandemic travel patterns in January 2020, the typical worker in 2021 in the Atlanta region could reach 82 percent more jobs; a worker in the Seattle area, 62 percent more jobs; in Houston, 50 percent more; and in Minneapolis, 42 percent more.
“These are huge changes to the opportunities people could access with a car—without any big infrastructure or land-use changes,” says Observatory senior researcher Andrew Owen, lead author of the reports. “Underlying the accessibility increases is a drop in peak drivership that has softened but is not going away. If we can take advantage of this and provide real alternatives to driving alone, we can keep congestion solved in our lifetime without freeway expansion.”
Improvement in the auto network was greatest in cities previously most burdened with congestion. The 2021 data shows that morning commuters in Los Angeles and San Francisco could drive to more than twice as many jobs in the same amount of time as they could the previous January, prior to the pandemic.
The 2021 transit data tells a different story. “Transit access depends on the service being provided by the agency, rather than changing immediately with demand,” explains Accessibility Observatory director Eric Lind, co-author of the reports.
Despite news of plummeting ridership nationwide, the span of jobs that workers could reach via transit in 2021 changed comparatively little across the busiest metro areas even with labor shortages, capacity restrictions due to health concerns, and financial uncertainty. “Federal grants for operations early in the pandemic helped maintain access to jobs for essential workers, who needed transit most,” Lind says. “The challenge now for transit agencies is to continue to maintain this level of accessibility they have been providing.”
The researchers say the recently published data reveals how changes in travel behavior can drastically improve the usefulness of the transportation system. The most recent analyses—part of the long-running Access Across America study of accessibility to jobs conducted since 2014—are the first comprehensive national survey of how changes in daily travel initiated by the COVID-19 pandemic looped back to significantly alter what opportunities people can reach.
Accessibility measures the interaction between land use and transportation networks, capturing the ease with which travelers can reach a desired destination. Typically, land use and transportation networks change only gradually from year to year, but 2021 illustrated a much different dynamic. The early COVID-19 pandemic period provided an unprecedented opportunity to study how the choices people make, and what they can reach, plays out in cities across America.
“Different modes are regulated differently by how many people choose to use them,” Owen says. “While auto access gets worse the more that people drive and with the corresponding increases in travel time, it’s different for transit, walking, and biking—an increase in the number of users matters less and can actually lead to investment that increases accessibility to jobs and opportunities.”
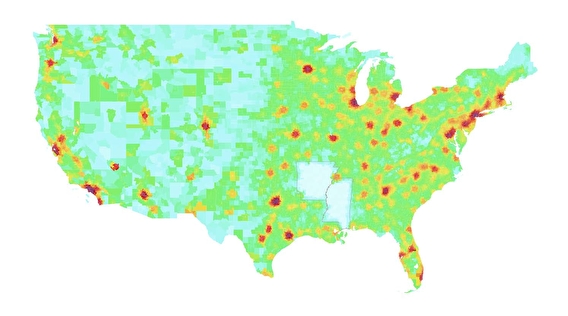
The Access Across America reports summarize accessibility to jobs, as recorded by the US Census Bureau, using three modes: driving, walking plus transit, and biking. The biking study is analyzed across different infrastructure networks, ranging from fully protected and separated lanes to travel in regular traffic lanes. For each mode, the researchers calculated the jobs reachable from each census block at different times during the morning peak travel hour. These results are then summarized and aggregated to various levels, including the top 50 urban areas (by population), which are featured in the reports.
The annual research project is sponsored by the National Accessibility Evaluation pooled-fund study, a multiyear effort led by the Minnesota Department of Transportation and supported by partners including the Federal Highway Administration and 13 additional state DOTs.
The Accessibility Observatory, a program of CTS, is the nation’s leading resource for the research and application of accessibility-based transportation system evaluation. Visit the Observatory website for the Access Across America research reports for auto, transit, and biking and associated publicly available data.