Time seems to fly when you’re having fun, but not when you’re waiting for a bus at an unsheltered stop. In a new study, U of M researchers found that several factors can have a measurable impact on riders’ perceptions of wait times. A shelter can make the wait seem shorter, for example, whereas for women, unsafe conditions can make the wait seem longer.
The study, sponsored by the Transitway Impacts Research Program (TIRP), grew out of the interest of several TIRP partners to learn how riders’ perceptions of wait time is affected by transit shelters, amenities such as posted schedules, and characteristics of surrounding areas. “Waiting time is a convenient way to measure how burdened a waiter feels,” explains Andrew Guthrie, research fellow with the Humphrey School of Public Affairs.
The research team gathered data at 36 stops and stations throughout the Minneapolis–St. Paul metropolitan area, ranging from unprotected curbside stops to light-rail stations and transit centers, Guthrie says. Collection took place at various times of the day during all seasons and weather conditions.
Data collection teams—consisting of one recruiter and one videographer—surveyed more than 880 riders. The recruiter asked just-boarded passengers to estimate the time they had spent waiting at that stop; the videographer provided an objective measure of the actual waiting time.
The overall results: “Perceived and actual wait times are clearly related, but the relationship is variable,” Guthrie says. “The waiting environment can change perceptions.”
Nearly 85 percent of those surveyed waited 10 minutes or less. Even with waits under a minute, however, people tended to perceive at least a minute or two, and they tended to estimate in round numbers (5, 10, 15 minutes). “This creates an initial ‘penalty’ of overestimates,” he says.
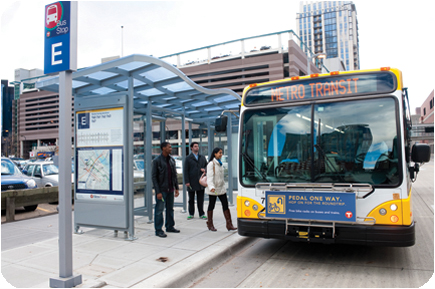
Researchers also found several variables to have statistically significant impacts. The presence of a shelter—even a simple one—made waits seem shorter, especially for waits less than 10 minutes. “The biggest difference in perception was between any shelter and none at all,” he says. The presence of a NexTrip real-time information sign also shortened perceived waits.
Posted schedules produced a “really interesting pattern,” Guthrie says. For shorter waits, schedules caused people to overestimate wait time, but after about 10 minutes, people began to underestimate it. “It’s possible that for short waits, people compare the clock and the schedule and get impatient, but for longer waits, they are reassured to know the bus or train is coming,” Guthrie says. “This implies that posting schedules is more important for routes with less frequent service.”
Gender alone was not significant, but there was a stark difference for women in less safe environments. “Most sites in the study were rated as safe, but at those that were not, there’s potential to improve the experience for riders and potential riders,” he says.
“With several major initiatives currently under way to expand the number of shelters at bus stops and to improve the quality of transit schedule information across our entire network, the timing of this project could not be better,” says Marilyn Porter, director of engineering and facilities for Metro Transit. “This study provides important insight that is directly applicable to the work that we are doing to ensure that our customers have the best possible experience using transit service in the Twin Cities.”
The model developed in the project includes many other variables such as household income, trip purpose, and the presence of benches and route maps. “Users of the model will be able to choose criteria and predict the impacts of hypothetical feature mixes,” Guthrie says.
A final report is planned for publication in March. Humphrey School associate professor Yingling Fan was the study’s principal investigator; David Levinson, RP Braun/CTS Chair in the Department of Civil, Environmental, and Geo- Engineering, was co-investigator.
TIRP was launched by the Hennepin County–University of Minnesota partnership and has grown to include a mix of funding partners and program supporters.


