
When transportation officials determine which route a heavy truck should take, their aim is maximizing efficiency while ensuring safety. Detours around bridges on critical freight routes increase fuel and labor costs for the trucking industry—and eventually hit consumer pocketbooks, too.
Until recently, these types of costly detours were often needed around three concrete slab-span bridges over Shingle Creek near Brooklyn Center, Minnesota. Some larger trucks were forced to detour an extra 15 miles or more on congested roadways.
In a MnDOT-funded study, U of M researchers investigated the three bridges to assess whether the calculated load rating reflected actual bridge behavior and determine if the load ratings and overweight permitting process could be updated.
Currently, most bridge load restrictions are calculated using bridge rating software from the American Association of State Highway and Transportation Officials (AASHTO). “Previous testing has found load ratings for many slab-span bridges to be overly conservative,” says Ben Dymond, an associate professor with Northern Arizona University (formerly with the University of Minnesota Duluth) and the project’s principal investigator.
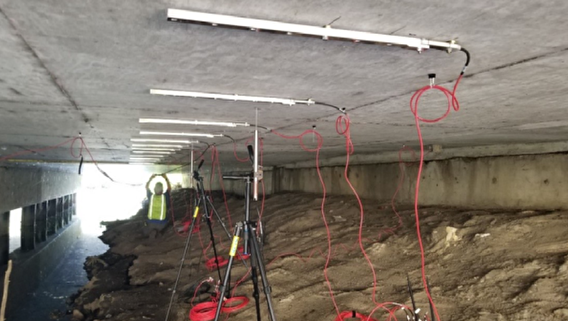
Researchers combined field testing with two modeling techniques to explore an alternative method of evaluating bridge load distribution. Their methods included both static and dynamic loading tests on the bridges: They measured the bridges’ responses when heavy trucks were parked on them at dozens of points and also when an impact hammer was used to apply force to a bridge deck. They used this data to create and validate two models—one simpler and one more complex—and compared the models and field data with the load ratings calculated by the AASHTO bridge software.
Comparing modeling and field data results to the AASHTO load distribution factors, the team found the AASHTO ratings to be conservative. “The load rating factors produced by our bridge-specific model—and validated with field data—were up to 24 percent greater than the ratings derived through the AASHTO process,” Dymond says.
Now, MnDOT can use the new load rating process to evaluate other slab-span bridges in its inventory. “This research gives MnDOT an alternative and more accurate method to evaluate load ratings of slab-span bridges,” says Yihong Gao, bridge rating engineer with MnDOT’s Bridge Office. “We can now implement a more flexible permitting process for trucks, alleviating costly bottlenecks and detours.”
In addition, the agency plans to apply the methods used in this study to other types of bridges and structures such as concrete box culverts, providing MnDOT even more flexibility in managing truck traffic and keeping freight moving efficiently.
Writer: Megan Tsai