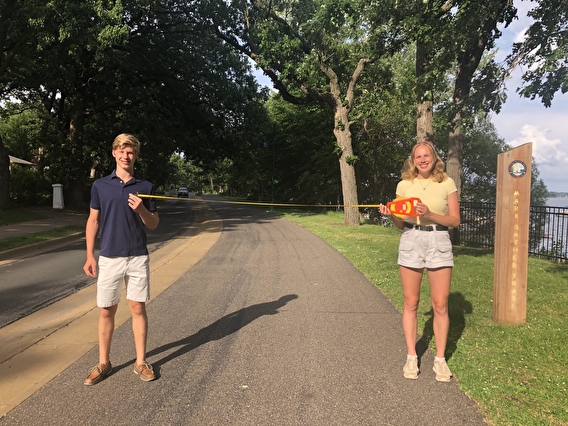
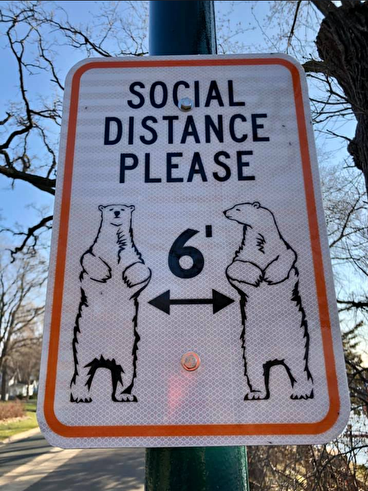
As gyms and indoor health facilities closed during the beginning of the pandemic, people flocked to trails and parks, creating both opportunities and concerns for public health and land managers. The US Centers for Disease Control and Prevention (CDC) recommended a six-foot distance between people (even outdoors), but little was known about compliance with these recommendations.
Now, a study led by U of M researchers finds that more than half of pandemic trail users were at risk of COVID-19 exposure during this time. The researchers used a novel approach for the study, integrating in-person observations of trail groups with automated monitoring of trail traffic volumes.
“Despite the availability of relatively low-cost sensors and calls to increase the monitoring of trail use, automated facility monitoring is not standard practice,” says Ingrid Schneider, a professor with the Department of Forest Resources and the study’s lead researcher. “The COVID-19 pandemic underscored the importance of this type of monitoring.” Findings were published in the Journal of Transport & Health.
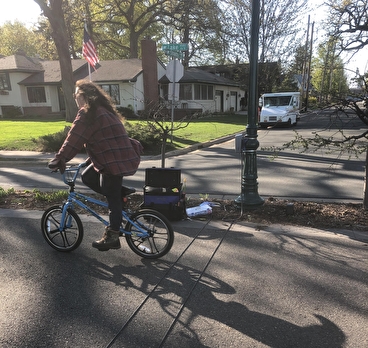
In spring 2020, project teams gathered data at the Sather Trail in White Bear Lake, Minnesota—a frequently used trail connecting a larger regional trail system and anchored by two beach areas. Trained observers, stationed at a safe distance, monitored nearly 1,500 trail user groups as they moved through observation zones to determine users’ compliance with physical distancing guidelines; trail traffic volumes were calculated using automated monitoring. The traffic volume estimates and observed distance data were integrated and used to estimate exposure to COVID-19 risk on the trail.
The data analysis revealed a lack of physical distancing among more than half of the observed groups, resulting in a risk of exposure to COVID-19. Of the nearly 1,500 groups tracked, about 70 percent had one or more encounters with another party. Further analysis showed that between 600 and 3,800 unique individuals who visited the Sather Trail during this time did not maintain social distancing in all interactions and were potentially exposed to risk.
“Our data also shows that compliance decreases with group user sizes and hourly traffic flow, making it likely that compliance rates on urban trails with similar width but greater use were even lower,” says Greg Lindsey, a professor with the Humphrey School of Public Affairs and the study co-author. “For vulnerable groups, this exposure would be even more significant than for the general population.”
According to the research team, this study illustrates the value of monitoring public facilities such as trails to provide better data for planning and policy decisions. “As more agencies successfully implement automated monitoring programs, our ability to assess the effects of major events like the COVID-19 pandemic will increase,” says Schneider.
The study did not incorporate mask use or the duration of exposure. Future research could videorecord sites to collect this information, Schneider notes.
The temporary automated counters used on the Sather Trail were supplied by MnDOT. The agency’s Pedestrian and Bicyclist Data Program manages a few dozen permanent automated people counters stationed throughout Minnesota, says Michael Petesch, MnDOT pedestrian and bicyclist data coordinator and a co-author of the paper.
The permanent counters were also used to improve statewide understanding of how active transportation activity changed during the pandemic. After analyzing the volumes from the previous several years, Petesch and his team developed a GIS story map—The Unique 2020 Spring: Pedestrian and Bicyclist Count Changes—which provides more insight into “where people were bucking historical walking and bicycling trends,” Petesch says.
“Since the first automated counters were installed in 2013, distinct walking and bicycling travel patterns—such as higher volumes during morning and evening rush hour—were consistently observed year after year until March 2020 when COVID-19 arose, prompting Governor Tim Walz to issue orders limiting travel and exposure,” Petesch says. “This resulted in a new reality where people shifted their work and life schedules, commuted less, and made more trips during the middle of the day.”
Providing accessible outdoor recreation opportunities that improve wellbeing while protecting people from COVID-19 and future pandemics will continue to be a balancing act, Petesch adds. “Using novel data collection approaches and strengthening interagency relationships will be useful for better understanding compliance with protective health measures and exposure to risk.”
Writer: Megan Tsai
