—John Siqveland, CTS communications director

Identifying Deer-Vehicle Collisions in Minnesota
“My daughter was coming up Proctor off the interstate and she was driving a relatively small car and she happened to hit a deer and it actually dropped into the roadway,” shares Ron Moen, senior research associate at the Natural Resources Research Institute in Duluth, MN. “She stopped and called me and said, ‘What do I do next?’”
“And I said, ‘Well, if it’s just lying there…pull it off the road.’ She and her friend grabbed the deer by the front legs and pulled it off the roadway. She had just gotten her license, so she was obviously a little bit traumatized.”
Thousands of Minnesotans have similar experiences every year with deer-vehicle collisions, or “DVCs.” How many thousands—and where exactly those DVCs are most likely to occur—is the focus of a MnDOT-sponsored research project by Moen and Raphael Stern, assistant professor in the Department of Civil, Environmental and Geo- Engineering (CEGE) at the University of Minnesota Twin Cities.
Stern is in CEGE’s Transportation Systems Group and his main interests are transportation data and analysis. He says this project presents an opportunity to use this deer crash data to improve how the transportation system is managed.
DVCs cost Minnesotans tens of millions of dollars in personal injuries and property damage each year, while also killing and maiming a significant percentage of the deer population. The Department of Public Safety (DPS) reports that between 2016–2020 an average of 1,244 DVCs occurred per year, including 18 fatalities and 124 serious injuries.
Thankfully, the majority of deer strikes aren’t as severe and don’t involve a police response. Insurance agency State Farm estimates that 1 in 81 Minnesota drivers experienced a collision with an animal resulting in an insurance claim from July 2022 through June 2023. Part of the research study involved using these numbers as an input, which Moen and Stern determined equated to about 40,000 DVCs per year across Minnesota. “That algorithm is proprietary, so we don’t know it,” Moen says. “So you’ve got 90 percent of DVCs that you don’t know where they’re occurring.”
Developing a way to do that is what brought this expert duo of wildlife ecologist and traffic engineer together.
Field and lab work
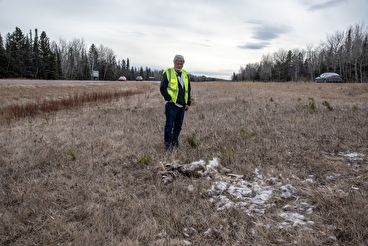
“Identifying Deer-Vehicle Collision Concentrations in Minnesota” started as a pilot project involving literature review, data collection and modeling, and field work in the Duluth area. Because DVCs are overwhelmingly a rural phenomenon, in 2021 Moen began driving regular routes in a 50-mile radius outside of the city to collect ground truth data on DVCs. This involved photographing and taking a GPS reading of each deer carcass he encountered. Moen’s expertise with animal predation supported an accurate count: “When there’s warmer temperatures, you can start to identify when a DVC occurred based on a few signals… If I come on a DVC and the eyes are complete and… it's a little bit graphic, but the blood that's coming out of the nose is still red and sometimes frothy, that's a fresh one.”
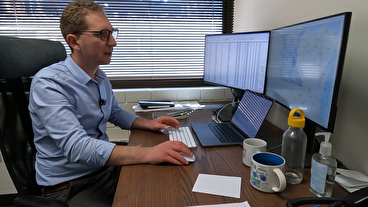
Stern, meanwhile, was applying his data and modeling expertise to five years of the DVC data collected by the DPS to record roadway characteristics. “We looked at the exact location of where each of those [collisions] occurred,” Stern says. “On that roadway, we gathered data from a whole bunch of different state and federal databases on roadway characteristics.” These included the width of the road, turns per mile, adjacent land use, adjacent vegetation types, proximity to bodies of water, and the presence of nearby features like bridges and culverts.
The following spring, while en route to St. Cloud, Moen began noticing a surprisingly high number of dead deer along the roadsides of I-35 and Highways 15 and 23. After consulting with Stern, the two proposed extending the project to include data collection along this central band of the state.
The locations of thousands of DVCs that Moen captured during his field work were added to the database, improving the modeling that could be extrapolated for the rest of the state. “We wanted to look beyond just that simple way of looking at things,” Stern says. “So we looked at per vehicle mile traveled perspective. We normalized based on per person who drives [the stretch of road], how many DVCs do we expect to see over the course of a year.”
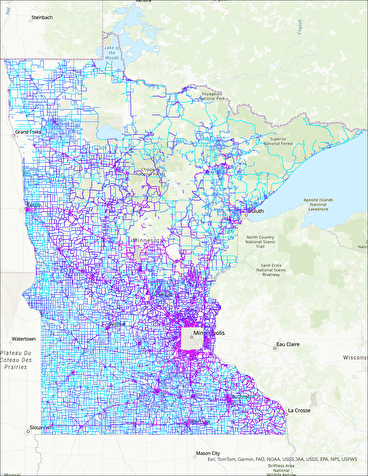
The interactive map developed for the project applies the model to every road segment in the state. Each segment is color-coded based on the estimated DVC risk. Clicking on segments shows a number of attributes, which provide a predicted likelihood of a DVC. “We can use all of the roads that have similar characteristics to come up with an actual estimate of how many DVCs we'd expect on average every year to occur on [a particular] road,” Stern says. “And instead of looking at the cumulative risk across all drivers, we’re looking at the per driver risk.”
Some surprises, some lessons
In addition to location, seasonality is a significant factor for DVC risk: According to Moen, the major peak occurs in the fall, from October to early December. “That’s the breeding season for deer, and [so] they’re just moving much more than they typically do,” he says. A minor peak in the spring coincides with birthing season; that’s also when yearlings are “kicked out by the female deer when she gives birth to a new fawn.”
Moen notes that drivers should be aware—especially during these periods—that deer are usually not alone and may have fawns or yearlings straggling behind the adults.
From a traffic engineering perspective, Stern found that the data about road segments provided some unexpected findings.
“What was somewhat surprising to me was things like how curvy the road is. Turns per mile. I would have expected that to correlate with higher crash rates, just because you always think of the example where… there's a deer around the corner and you just can't see them,” he says. “The other was road width. I would have expected [with] wider roads, you have better visibility, you can see the deer better. But it turns out the wider roads had much higher DVC crash risk.”
Because speed correlates highly with risk, Stern notes that curves are less risky for DVCs because speed limits are reduced and drivers tend to slow down. Conversely, on wider roads, even with high visibility, the risk is great. “You think of a rural highway where you might be traveling 65 miles per hour, and that’s the point where if you can’t see the deer in time, the DVC becomes pretty likely,” he says.
Relatedly, the reduced visibility around dusk means DVCs are most likely during the evening commute. “Expect there might be a deer,” advises Stern. “If you just slow down 5 or 10 miles per hour, that gives you a little more time to react.”
The road ahead
Moen and Stern are currently putting the final touches on their research report, which they expect to provide to MnDOT this summer. They note that their findings could be used to help transportation professionals most cost-effectively target the highest-risk roads for interventions such as high fencing or even motion-activated warning sensors. It’s possible that high-cost interventions such as overpasses for wildlife crossings (more common in western states with moose and elk populations) could be evaluated in areas where the number of DVCs is consistently high, dangerous, and costly. The findings could also be used to develop targeted public service announcements or advertising campaigns.
Regardless of exactly which applications the data is ultimately used for, collecting and presenting it is the first step—and a first for Minnesota. “Given the enormous cost of DVCs, if we reduce them even one or two percent, we’re saving a lot of financial costs and emotional costs,” Moen says.