Gathering, sharing, and analyzing data is important in traffic and transit management. It is even more so in the midst of the COVID-19 pandemic: a fast-moving threat that must be met with well-informed cooperation.
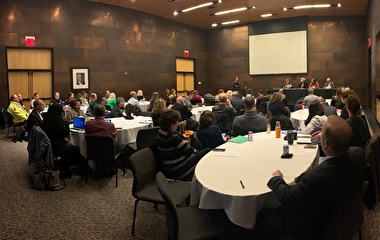
To address this need, the CTS Research Councils convened online in June for a webinar on the pandemic’s effects on transportation. Researchers and traffic professionals from state and Twin Cities metro agencies were invited to present and weigh in on the issues.
Statewide, there were significant changes to traffic patterns in response to the virus. Mike Hanson from the Minnesota Department of Public Safety noted a 30 to 50 percent drop in traffic volumes on all roadways within the state immediately following the March 27 stay-at-home order.
“This is kind of a mixed bag for those of us in the traffic safety industry,” Hanson said. “[With] less cars [and] less traffic, we were seeing less crashes.” Crash severity, however, went up, potentially because decreased traffic congestion and the misperception of decreased law enforcement led to more high-speed violations on the roads.
The Twin Cities metro experienced drastic changes in how often people left the house. Using privacy-protected, aggregated spatial data from smartphones, computer science and engineering professor Shashi Shekhar found that from early March to April, visits to many places (except grocery and hardware stores) sharply declined. Visits to restaurants and bars increased in May, however, raising disease transmission risks.
A presentation by Ashley Asmus and Jonathan Ehrlich from the Metropolitan Council expanded on this research, explaining how the council launched a survey in May to gather more granular details about who was traveling and why.
Teleworking, for example, has become more common than driving in households making more than $50,000 a year: of those surveyed, 54 percent telework, 33 percent drive, and 10 percent have become unemployed. In contrast, in households making less than $50,000 annually, 36 percent drive, 24 percent telework, and 34 percent are unemployed.
“So when we’re talking about supporting continued telework in our region,” Asmus said, “we need to be really conscious about the groups and people that we’re leaving out of that story."
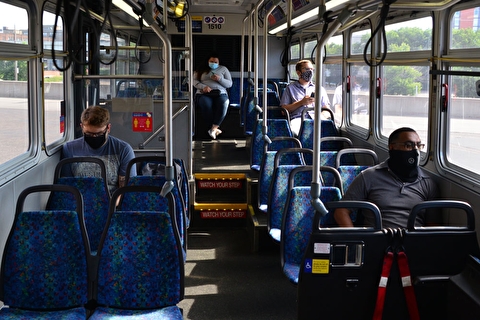
Metro Transit has had to grapple with the effects of the pandemic very directly. The agency has been implementing passenger limits—10 people to a 40-foot bus—and rearranging schedules to accommodate changed demand.
“How can we maintain mobility for those who need it?” asked Eric Lind, manager of research and analytics at Metro Transit. “Clearly, people still need to get around.”
Assistant Professor Alireza Khani from the Department of Civil, Environmental, and Geo- Engineering (CEGE) discussed his development of a mathematical simulation that can analyze the relative risk of traveling on buses. Using multiple data sources—including automatic passenger counters—he calculates how long riders tend to stay on a bus and how many people they might encounter. This allows him to gauge the relative COVID-19 risk of a given route at a given time of day. The research is sponsored by the Office of the Vice President for Research COVID-19 Rapid Response Grants and the CEGE department.
Writer: Sophia Koch


