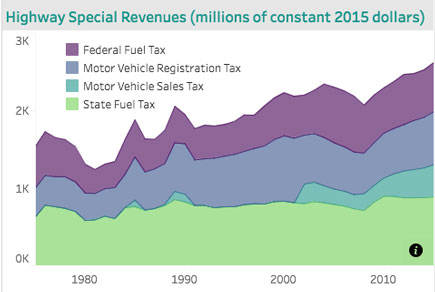
Researchers with the U’s Transportation Policy and Economic Competitiveness Program (TPEC) have added a visualization tool to their online finance database.
“We decided to create a data-visualization tool so more people can have access to and easily understand the data available in the Minnesota Transportation Finance Database, and overall, to better understand Minnesota’s transportation finance,” says Camila Fonseca, TPEC research associate. She and research assistant Nate Bean completed the refinements under the guidance of Associate Professor Jerry Zhao.
The data dashboards are available through a public version of Tableau, an interactive data visualization product, so users do not need to have a Tableau account to access the data visualization. Most of the dashboards are interactive, allowing users to pick variables that better fit their needs in a dynamic way, Fonseca says.
The graphs in the dashboards show the evolution of motorization trends, including vehicle registration, fuel consumption (aggregated at the state level), and vehicle-miles traveled (aggregated at the county level), as well as transportation finance for highways and urban and rural transit (all at the state level).
The database is composed of annual data from various transportation funding sources—at the state, MnDOT district, and local levels—as well as transportation expenditure allocations in Minnesota. It also includes state road construction expenditures (by county), operations and maintenance expenditures (by MnDOT district), and vehicle count and registration tax (by county).
The tools are available on the TPEC website.


