U of M researchers updated their datasets and completed a new analysis of transportation funding redistribution in Minnesota. “Unlike local funding, federal and state transportation funding may be collected in one area and redistributed to others,” explains principal investigator Jerry Zhao, associate professor in the Humphrey School of Public Affairs.
For the six-year period between 2010 and 2015, Zhao’s team found that the Twin Cities Metro district contributed slightly more than it received. “It contributed about 49 percent of federal and state transportation revenues and received about 47 percent back in expenditures,” he says.
A previous study using data from 2009–2014 found that the Metro district contributed about 48 percent of federal and state transportation revenues and received about 51 percent of expenditures (see May 2017 Catalyst).
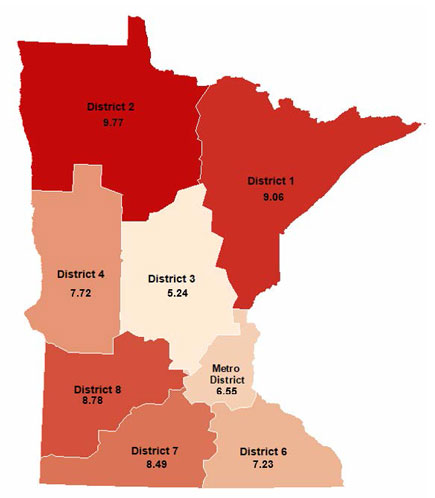
In both six-year periods studied, most districts in Greater Minnesota received more federal and state funding than they contributed. “For example, District 1 and District 2 received more than they contributed, probably due to a much lower population density in these areas,” Zhao says. “District 3, however, contributed more than it received.”
The analysis included three steps. First, the researchers calculated the share of transportation revenues contributed from different localities. Next, they examined the share of federal and state transportation expenditures (i.e., costs such as construction and maintenance) across different localities. Then, they compared the expenditure share and the revenue share for each district to see what areas contribute more than they receive, or verse versa. Findings are presented for both roadway development and public transit.
Others on the research team included Adeel Lari, director of innovative financing in the Humphrey School’s State and Local Policy Program, and Camilla Fonseca Sarmiento, research associate in the U’s Institute of Urban & Regional Infrastructure Finance.
In an additional analysis, the researchers examined the funding structures for roadways and transit in Minnesota. They found that during 2010–2015, local efforts accounted for about 45.5 percent of total roadway funding in Minnesota. Metro counties had a higher reliance on local efforts—about 56 percent.
For another perspective, the team also assessed the roadway funding structure per vehicle-mile traveled (VMT). “Overall, we calculated an average cost of roughly 7 cents per vehicle-mile traveled in the state,” Zhao says. “Districts in the north of the state had the highest expenditures per VMT.”
The transit structure analysis showed that about 65 percent of public transit expenditures in Minnesota comes from federal and state special revenues. Fare revenue accounted for about 14 percent, while other local efforts accounted for about 21 percent.
One final conclusion: “Overall, we found that local governments fund a significant proportion of the transportation infrastructure in Minnesota, primarily through the property taxes they collect,” Zhao says.
“This work helps inform the larger discussion on transportation funding in Minnesota by unveiling the questions on who funds transportation and how those resources get distributed across the state,” says Ken Buckeye, pricing program manager with the Minnesota Department of Transportation.
The work was completed as part of the U’s Transportation Policy and Economic Competitiveness Program (TPEC). A paper summarizing the analysis is available on the TPEC website.


