access to jobs.
A new report from the University’s Accessibility Observatory estimates the accessibility to jobs by transit in 49 of the 50 largest (by population) metropolitan areas in the United States using transit schedules from January 2015.
“Transit is used for an estimated 5 percent of commuting trips in the United States nationwide, making it the second most widely used commute mode after driving,” says Andrew Owen, director of the Observatory.
The analysis calculated travel times by transit using detailed pedestrian networks and full transit schedules for the 7:00–9:00 a.m. period. The calculations include all components of a transit journey, including “last mile” access and egress walking segments and transfers, and account for minute-by-minute variations in service frequency.
Rankings are determined by a weighted average of accessibility, with a higher weight given to closer, easier-to-access jobs. Jobs reachable within 10 minutes are weighted most heavily, and jobs are given decreasing weights as travel time increases up to 60 minutes.
Based on this measure, the Observatory estimated the 10 metropolitan areas with the greatest accessibility to jobs by transit, and for which sufficient data are available (see sidebar).
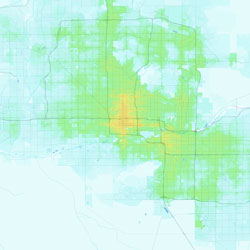
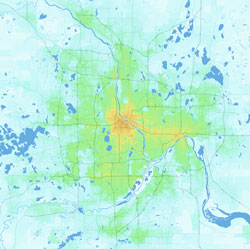
The report also presents detailed accessibility values for each metropolitan area and block-level maps that illustrate the spatial patterns of accessibility within each area, as well as a U.S. census tract-level map that shows accessibility patterns at a national scale.
The accessibility metrics presented in this report are designed to be comparable to those presented in the Accessibility Observatory’s earlier Access Across America: Auto 2015 report. “Taken together, these reports provide a comprehensive view of the relative accessibility impact of auto and transit systems across different cities,” Owen says.
For example, the Phoenix and Minneapolis–St. Paul metropolitan areas have effectively the same total number of jobs (1.7 million; ranked 13th and 14th respectively), and their auto accessibility rankings are also very close—13th and 12th. “However, they differ significantly in their transit accessibility rankings: Minneapolis–St. Paul ranks 12th in transit access to jobs, while Phoenix ranks 22nd,” he says.
The research was sponsored by the National Accessibility Evaluation Pooled-Fund Study, a multi-year effort led by the Minnesota Department of Transportation and supported by partners including the Federal Highway Administration and 10 state DOTs.
Future comparison reports will track the way that accessibility in these metropolitan areas evolves in response to transportation investments and land-use decisions, Owen says.
The research report and additional information about the study are available on the Accessibility Observatory website.


