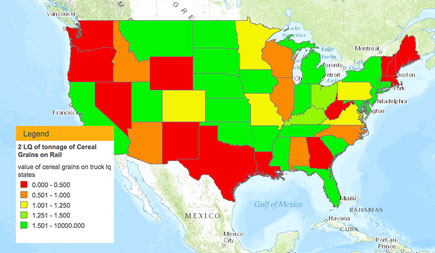
compared to the national average.
Freight rail has a profound effect on the economic vitality and competitiveness of Minnesota and, in particular, some of its most important industries. To better understand freight flows and foster the growth of freight infrastructure, U of M researchers are creating a new online platform—the National Freight Economy Atlas.
The project is a combined effort of the U’s Transportation Policy and Economic Competitiveness Program (TPEC), Esri (a geographic information systems company), and the Center for Information Systems and Technology at Claremont Graduate University. Additional funding for the project was provided by BNSF Railway.
“The project is dedicated to analyzing the connections between freight movement and industry cluster development,” says Lee Munnich, TPEC senior fellow at the Humphrey School of Public Affairs. The atlas allows users to analyze the freight infrastructure at the national, regional, state, and metropolitan/combined statistical areas.
“One of our goals for this project and for other recent work has been to reach out to a variety of stakeholders in the freight and rail industries,” says TPEC visiting research scholar Tom Horan, also a professor at Claremont Graduate University. “We want to engage Minnesota’s transportation policy community in understanding how to leverage the dynamics of freight rail to add value to the state’s economy and transportation planning.”
The atlas incorporates data from the US Census 2012 Commodity Flows Survey, the Federal Highway Administration Freight Analysis Network, and the Bureau of Economic Affairs.
“We use unique methodological approaches to analyze the freight infrastructure,” Horan says. “In particular, we incorporate the use of the location quotient to better understand commodity movements between regions.”
The location quotient (LQ) is an economic formula used to compare various regional attributes to the national average. It can quantify how concentrated a particular industry or cluster is and reveal what distinguishes a particular region. “Using this formula, our research team developed an LQ for freight flows,” he says.
The atlas displays information in a series of interactive maps. National and regional maps provide detailed analysis of freight and economic clusters. These interactive applications allow users to maneuver between different regions, pick various attributes to display, and adjust to different levels of data.
Industry cluster maps provide freight economy information geared to specific characteristics of industry clusters, such as cereal grains or base metals. “For example, users can see the proportion of cereal grains sent on rail compared with the national average,” Horan says.
Story maps provide insights into supply chains enhanced by freight transportation. “A story map is a strategy that uses a graphic organizer to help users provide a narrative of elements or a topic through a story,” Horan explains. “Many different types of stories can be geographically organized and easily understood using the story map graphic organizer. One example on the atlas is a story map of the transport of agricultural products originating in Minnesota and distributed across the Great Northern Corridor.”
Moving forward, the research team will assess public and private stakeholder uses of the atlas, including specialized analyses for planning, policy, and private-sector considerations. Other future directions are to host a forum on economic competitiveness and supply chains, conduct case studies of locally linked supply chains, and assess the value-added benefits of industry clusters to state and regional transportation planning and development, Horan says.


